Revenues and Expenditures
Revenue: Where The Money Comes From?
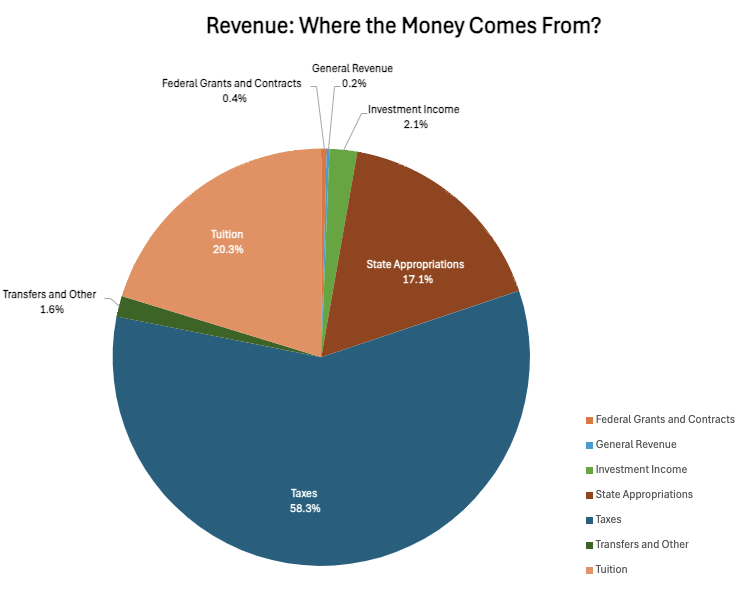
Revenue: $621,204,332
- 58.3% Taxes
- 20.3% Tuition
- 17.1% State Appropriations
- 1.6% Transfers & Other
- 0.2% General Revenue
- 2.1% Investment Income
- 0.4% Federal Grants & Contracts
Expenditures: Where The Money Goes - Who?
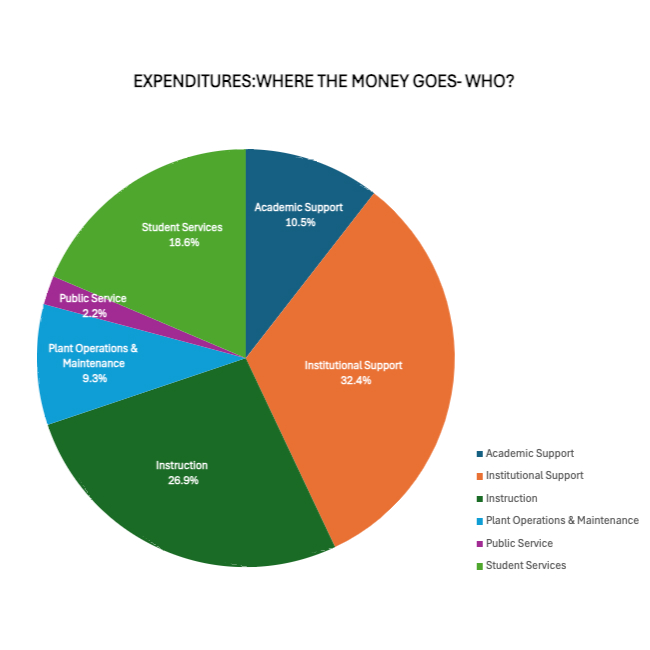
Expenditures: $621,204,332
- 26.9% Instruction
- 32.4% Institutional Support
- 18.6% Student Services
- 9.3% Plant Operations & Maintenance
- 10.5% Academic Support
- 2.2% Public Service
Expenditures: Where The Money Goes - What?
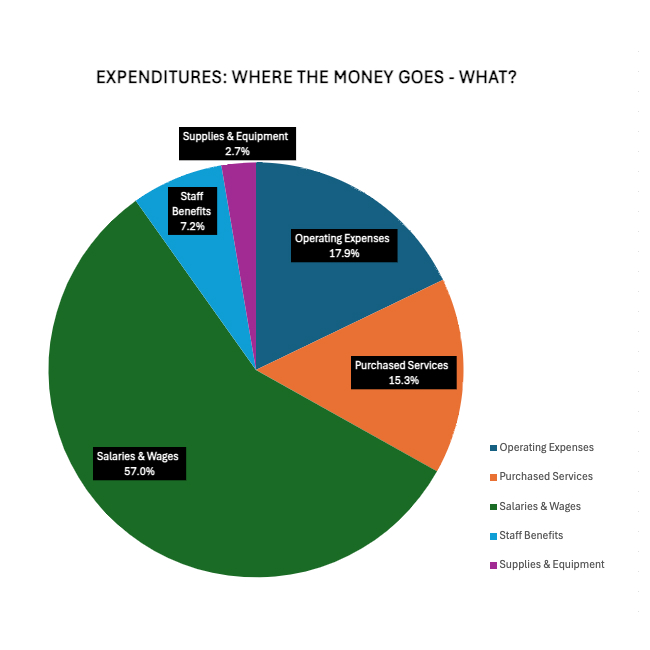
Expenditures: $621,204,332
- 57% Salaries & Wages
- 17.9% Operating Expenses
- 7.2% Staff Benefits
- 15.3% Purchased Services
- 2.7% Supplies & Equipment
Accessibility
Dallas College is committed to ensuring accessibility of its digital technology and is actively working to increase the accessibility of this webpage and electronic documents. Should you experience any difficulty in accessing information on this webpage, please contact Diana Wilder at 972-860-7710 or dianawilder@dallascollege.edu.